Low VIX does not predict the future
I noticed last week that my favorite jeans are not fitting anymore. That hasn’t happened in years! It must be a sign that I will lose weight in the near future! Wait, that doesn’t make any sense, does it? Either my jeans don’t fit anymore because I’ve gained weight or they shrank in the wash… amongst a host of other possible reasons. Regardless of why it happened, the fact that they don’t fit me cannot predict what will happen next. Maybe, after realizing that they don’t fit anymore, I hit the gym and lose weight. Or I could spiral into a depression and gain even MORE weight. Or if the jeans shrank because I left them in the dryer for too long, I could just go buy a new pair – no weight change at all.
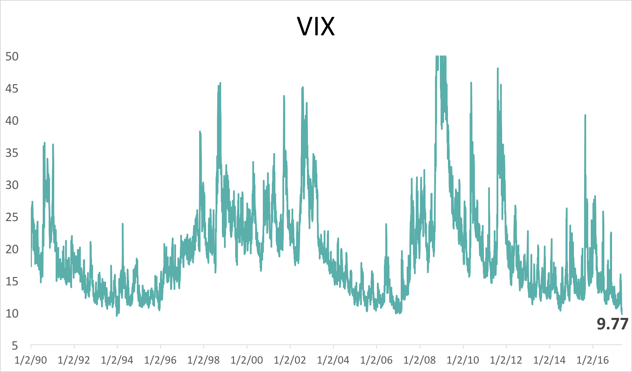
It seems that some market commentators are using the same reasoning with current low volatility. If the VIX hit a new all-time low, it MUST mean we are about to see negative equity returns!
A bit of background on the VIX
Let’s start with defining volatility. Volatility is the degree of variation in the everyday market prices. If there is a big swing in high and low prices, volatility is high; if there is very little movement, volatility is low. The Chicago Board Options Exchange Volatility Index (ticker symbol VIX) is a measure of the implied volatility of the S&P 500 options market. High VIX means markets are volatile, low VIX means markets are not volatile. It is designed to measure what options traders expect volatility to be over the next 30 days. But traders are just as human as the rest of us and they cannot see into the future. Or can they? Let’s test it.
If we look at the S&P 500 and the VIX daily prices going back to 1990, and we normalized their daily returns*, the relationship between them (correlation) is -0.73. Correlations range between -1 and 1, so a -0.73 is fairly strong. Which makes sense, as the VIX often drifts inversely to equity prices as traders wrestle with greed and fear. But that’s looking at the VIX and the equity markets without a lag, it’s a snapshot of the changes in each at that moment in time.
If we lag the VIX data to predict equity returns for the next month, over the same 27-year period, the correlation drops to 0.001 i.e. no correlation. Meaning that historically, VIX has no consistent predictive power of future equity returns (I ran the same exercise with a lag of 10, 20, 40, and 60 days, as well as with the VIX level instead of a change of Log, and I got similar results). Getting back to my jeans – yes on the day that I try my jeans on there might be a relationship between the jeans and my weight, but that relationship doesn’t predict how my weight will change in the future.
So VIX levels over time don’t predict future equity volatility. But what if instead of looking at the relationship throughout time, we look at periods of extremely low or extremely high volatility? Well, things get a bit more interesting.
VIX Outliers
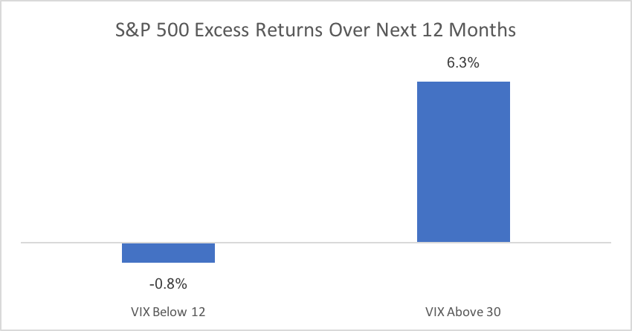
Between 1990 and 2017 the monthly VIX level has ranged between 9 and 69. We analyzed the monthly data for both the S&P 500 and the VIX during this period and focused on the outliers from a volatility perspective. It turns out that there were 27 months, from these 328 months, in which the VIX was below 12 or above 30. If we use each of these outlier months to predict the following 12-month S&P 500 returns, we get the following:
- VIX below 12: 9.7% median returns
- VIX above 30: 16.8% median returns
Now keep in mind the median equity return during this period was 10.5%.
Basically, what the below chart tells us is that a high-level VIX might be a good indicator of when to buy equities, while a low VIX level is not a very good indicator of when to sell them.
Supporting Research
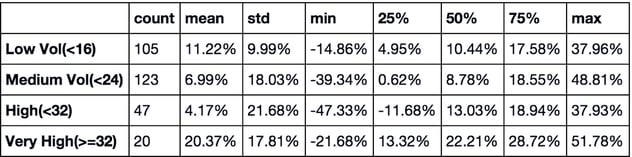
John Hwang over at Morgan Stanley, did a similar exercise using VIX outliers of 16 and 32 and mean returns of the equity markets (instead of median returns like we did). He found similar results, as the table below indicates. Although to be honest, I prefer using a VIX low-level outlier of 12 versus 16 as a cut-off point, since at 16 you capture more than one-third of the observations.
So, what now?
In conclusion, what we can take out of this is that VIX shouldn’t be used as a consistent predictor of changes in equity returns. It has no predictive power – there is no correlation between VIX levels and equity returns throughout time. However, extremely elevated VIX levels do appear to predict equity returns consistently. Meanwhile, very low levels of VIX are again useless to us as a variable used to predict the future.
The most likely reason for this is that when volatility is high, we humans tend to behave irrationally, creating good opportunities to buy. However, when volatility is low, we aren’t being as irrational, or we can stay irrational for much longer periods of time, which both create fewer opportunities. So irrationality is not perfectly inversely proportional – meaning that the highs and the lows don’t work as strongly in both directions i.e. only the high periods act as potential predictors of future returns.
Ultimately, the current low VIX level doesn’t tell us anything about what’s to come.
If you enjoyed this post, check out Markets Are Stable Because The World Is In A Better Place.
*Didn’t want to bother you with the details, but basically, I took the change of the Log of the level daily prices of the S&P 500 and the VIX, instead of just the level or the % change. Why? Because you can’t go below 0 in the indexes so % change does not provide us with a proportionate relationship between a price moving up or down.